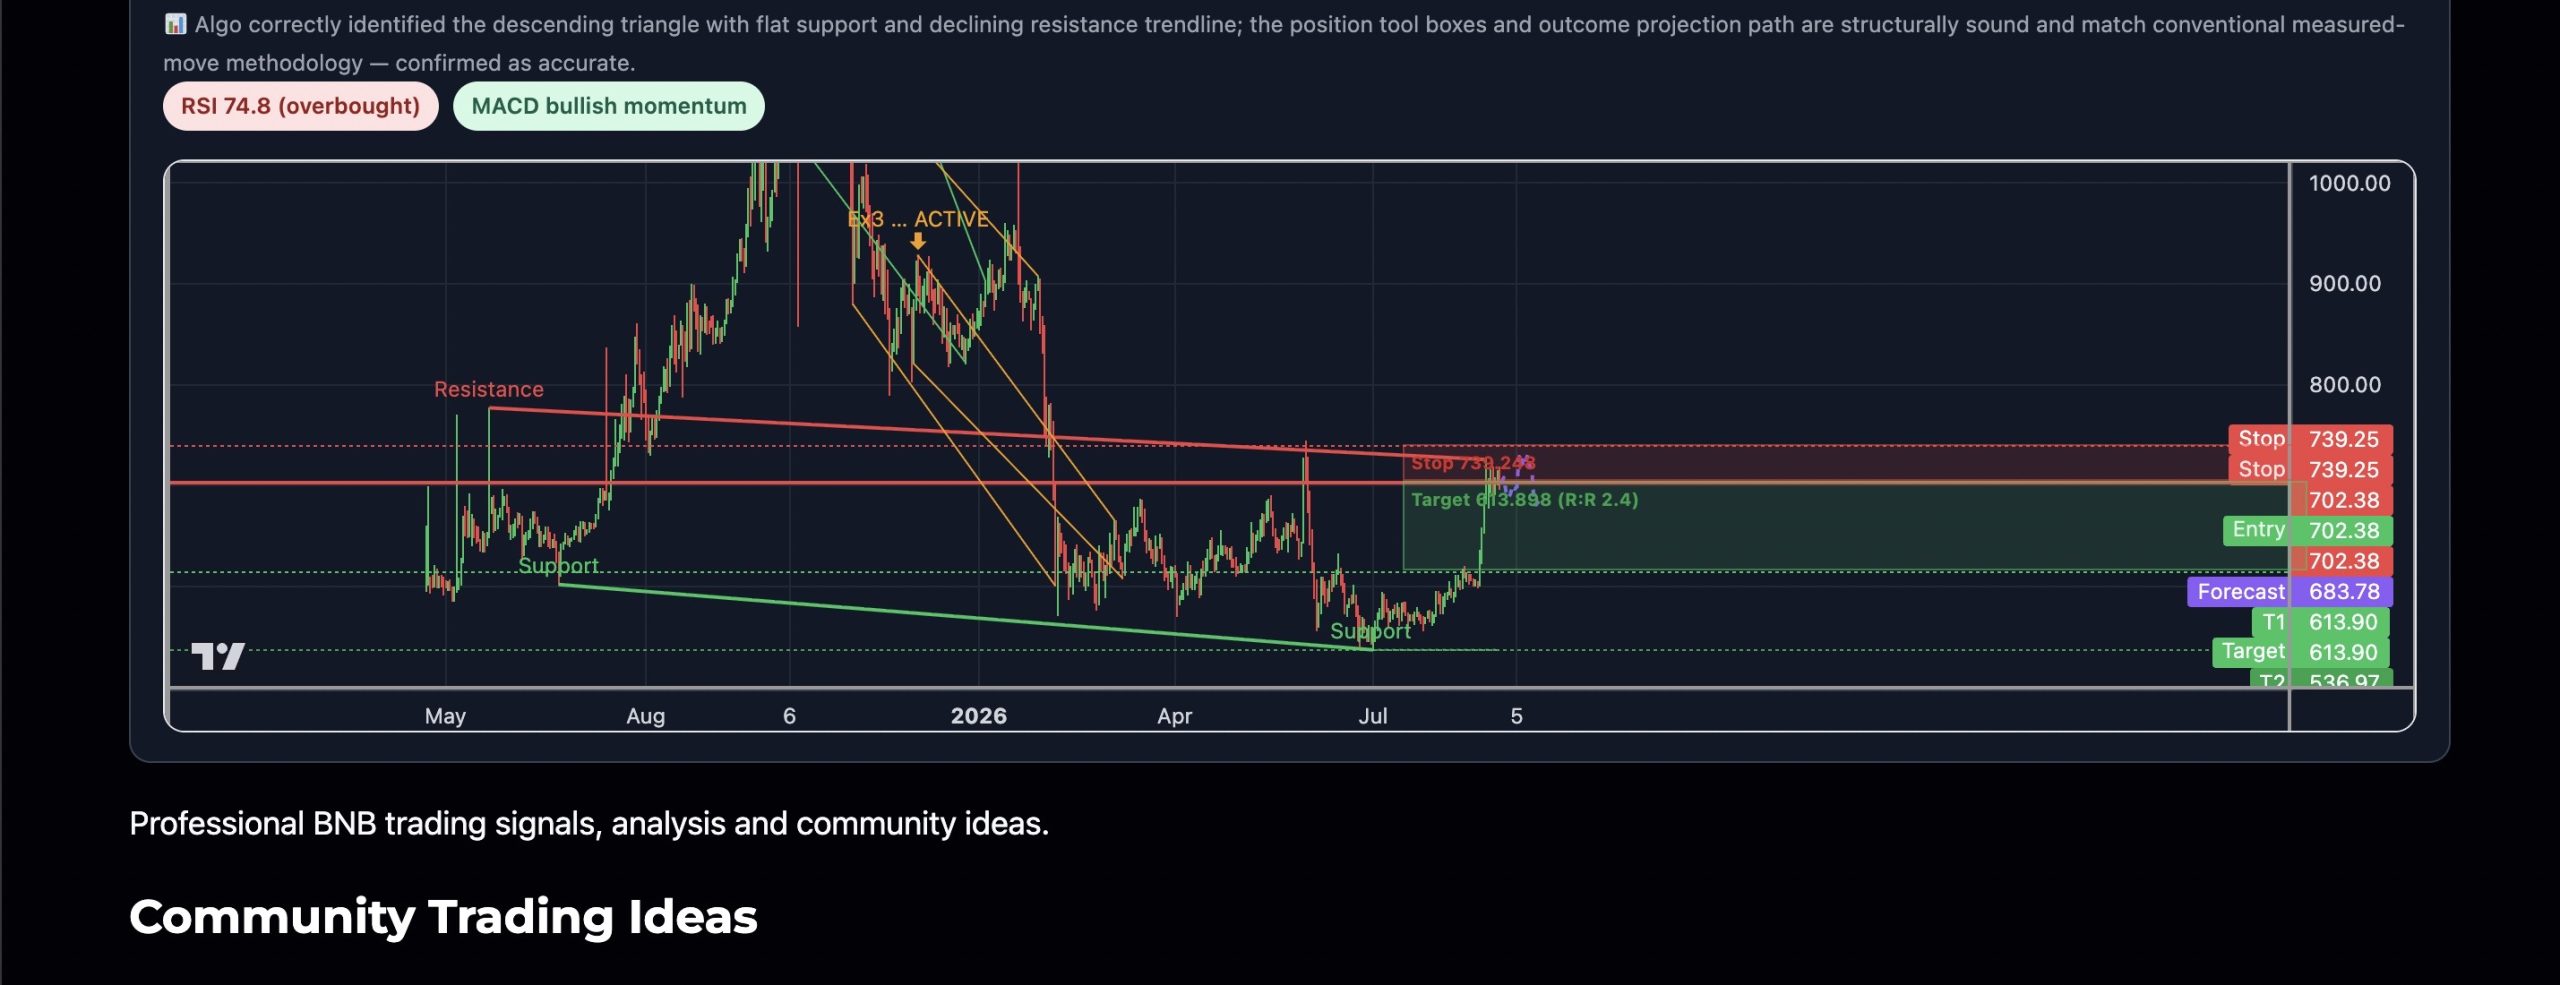


BNB is printing a textbook Descending Triangle on the 1D chart: a flat horizontal support shelf near $536–$601 is being compressed by a series of lower highs forming a descending resistance trendline from the ~$777 peak down toward current price ($702). The algo found 7 historical analogues of this exact schematic on BNB’s own price history — the closest winning replay originated near $1,375 resistance with a breakdown that accelerated once the flat support cracked. RSI is currently elevated at 74.8 (overbought) with MACD in bullish momentum state, which means the pattern is still in its compression phase — the overbought RSI inside a descending triangle is a classic bull-trap setup before the structural break lower. The most likely outcome replayed from the best historical win case projects a drift toward $730 before rolling over and breaking horizontal support, targeting $613.