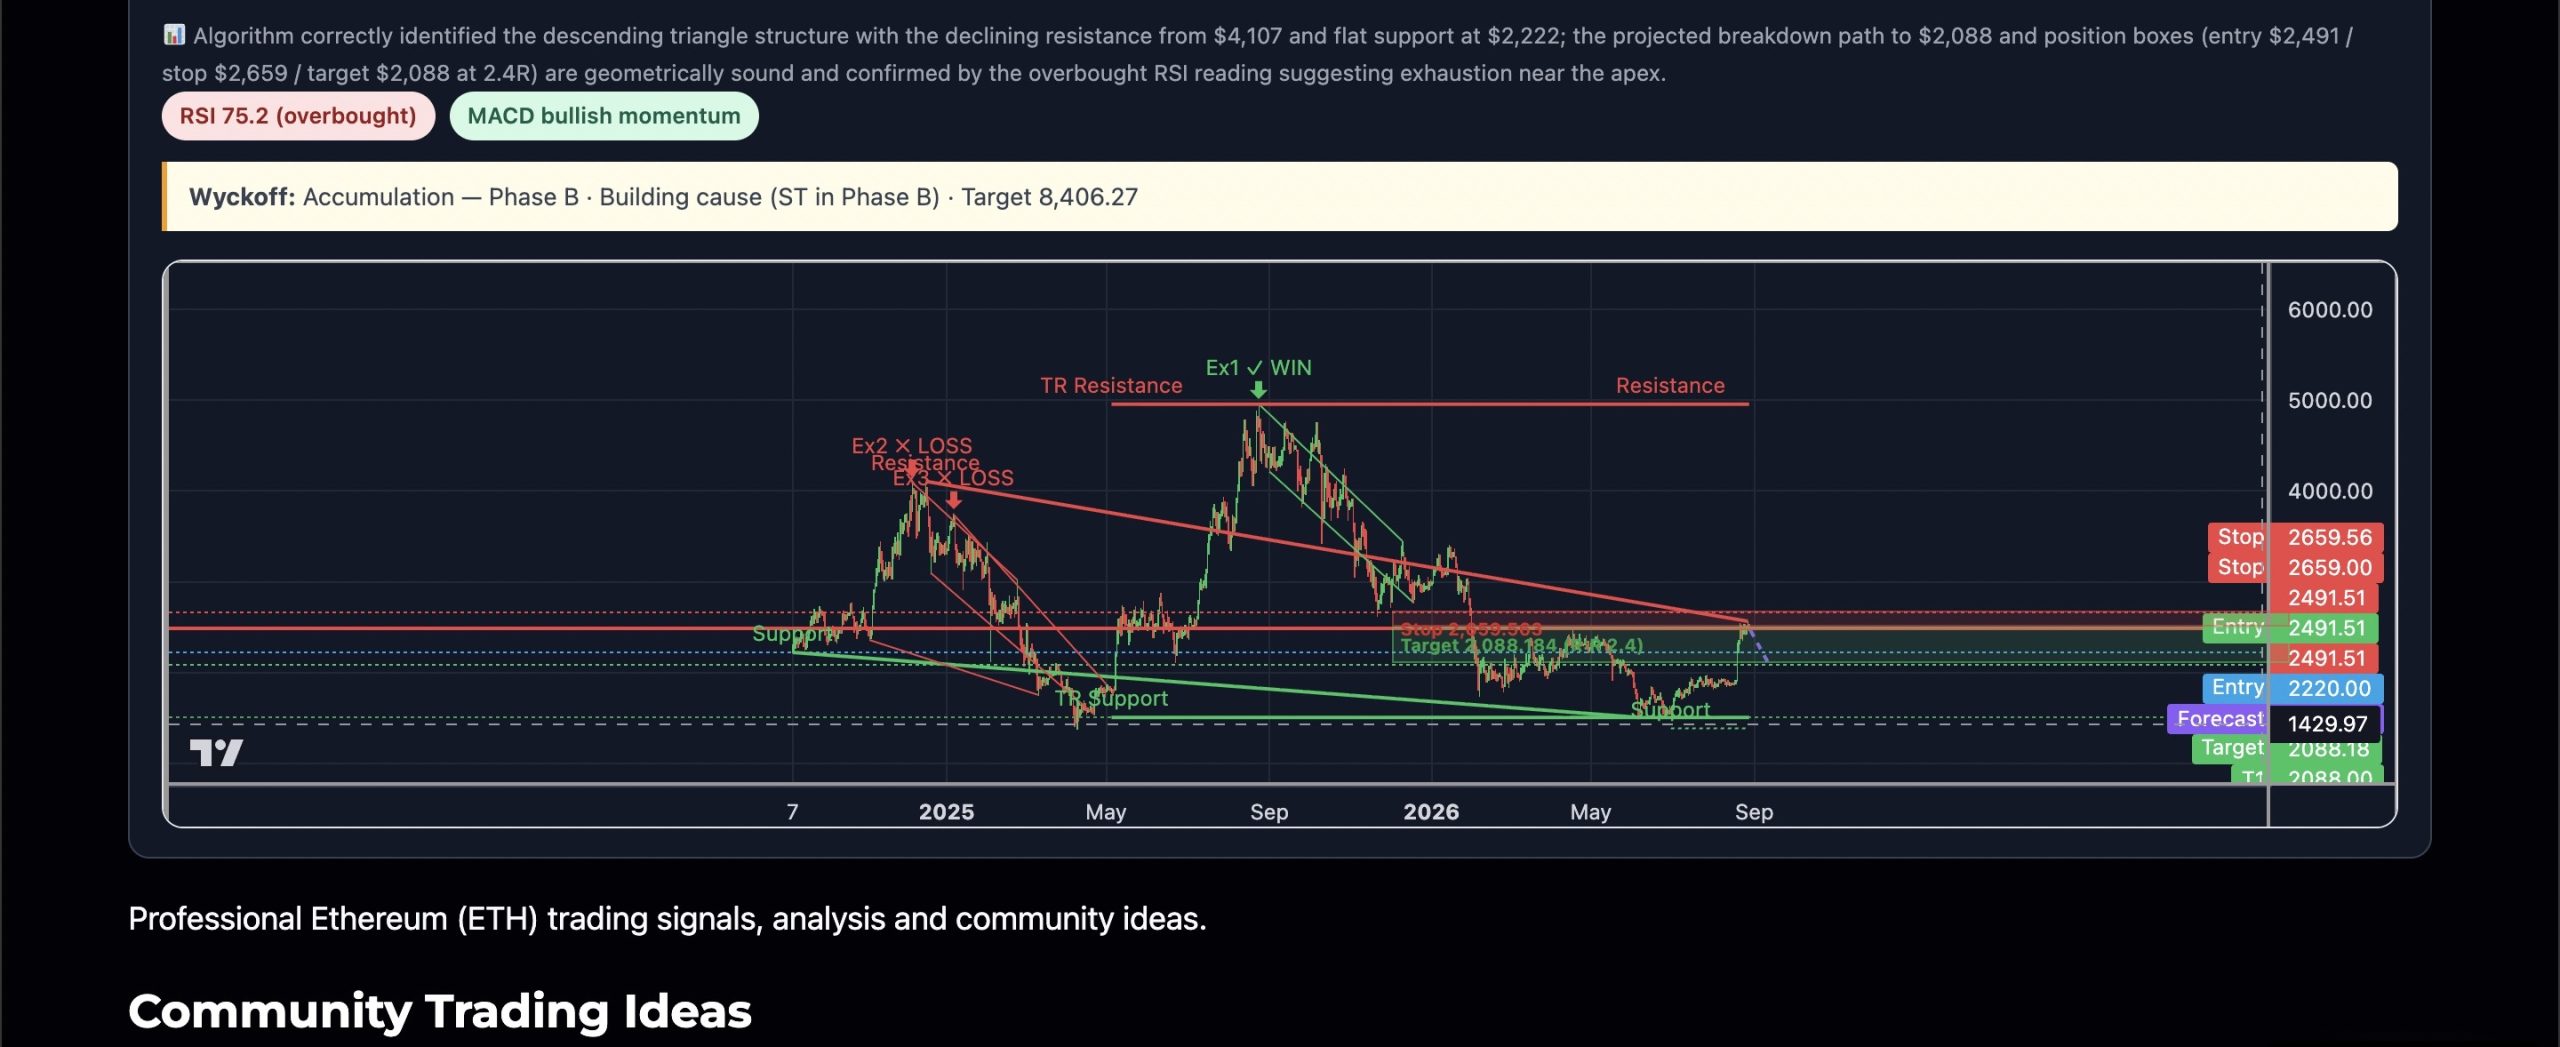


ETH’s 1D chart is carving a textbook Descending Triangle: a declining resistance trendline from the ~$4,107 December high compressing price into a rising-but-flat support shelf near $2,220. Price is currently testing the apex zone at $2,491, with the pattern classified as actively playing out. RSI is at 75.2 (overbought) while MACD is in bullish momentum — a divergence that historically precedes sharp rejection inside descending triangles, as the momentum wanes just before the structural break. The outcome projection, replayed from the best historical analog (Dec 2024 → Mar 2025 descending triangle that resolved bearishly), maps a measured-move breakdown targeting $2,088. Wyckoff context suggests a broader Accumulation Phase B trading range (TR support ~$1,505 / TR resistance ~$4,956), meaning the descending triangle could be a deep Phase C re-test before a larger markup — but the immediate 1D setup favors a short-side measured move first before any macro bull cycle continuation.