

BTC inverse H&S failed, the algo has correctly identified a Double?…
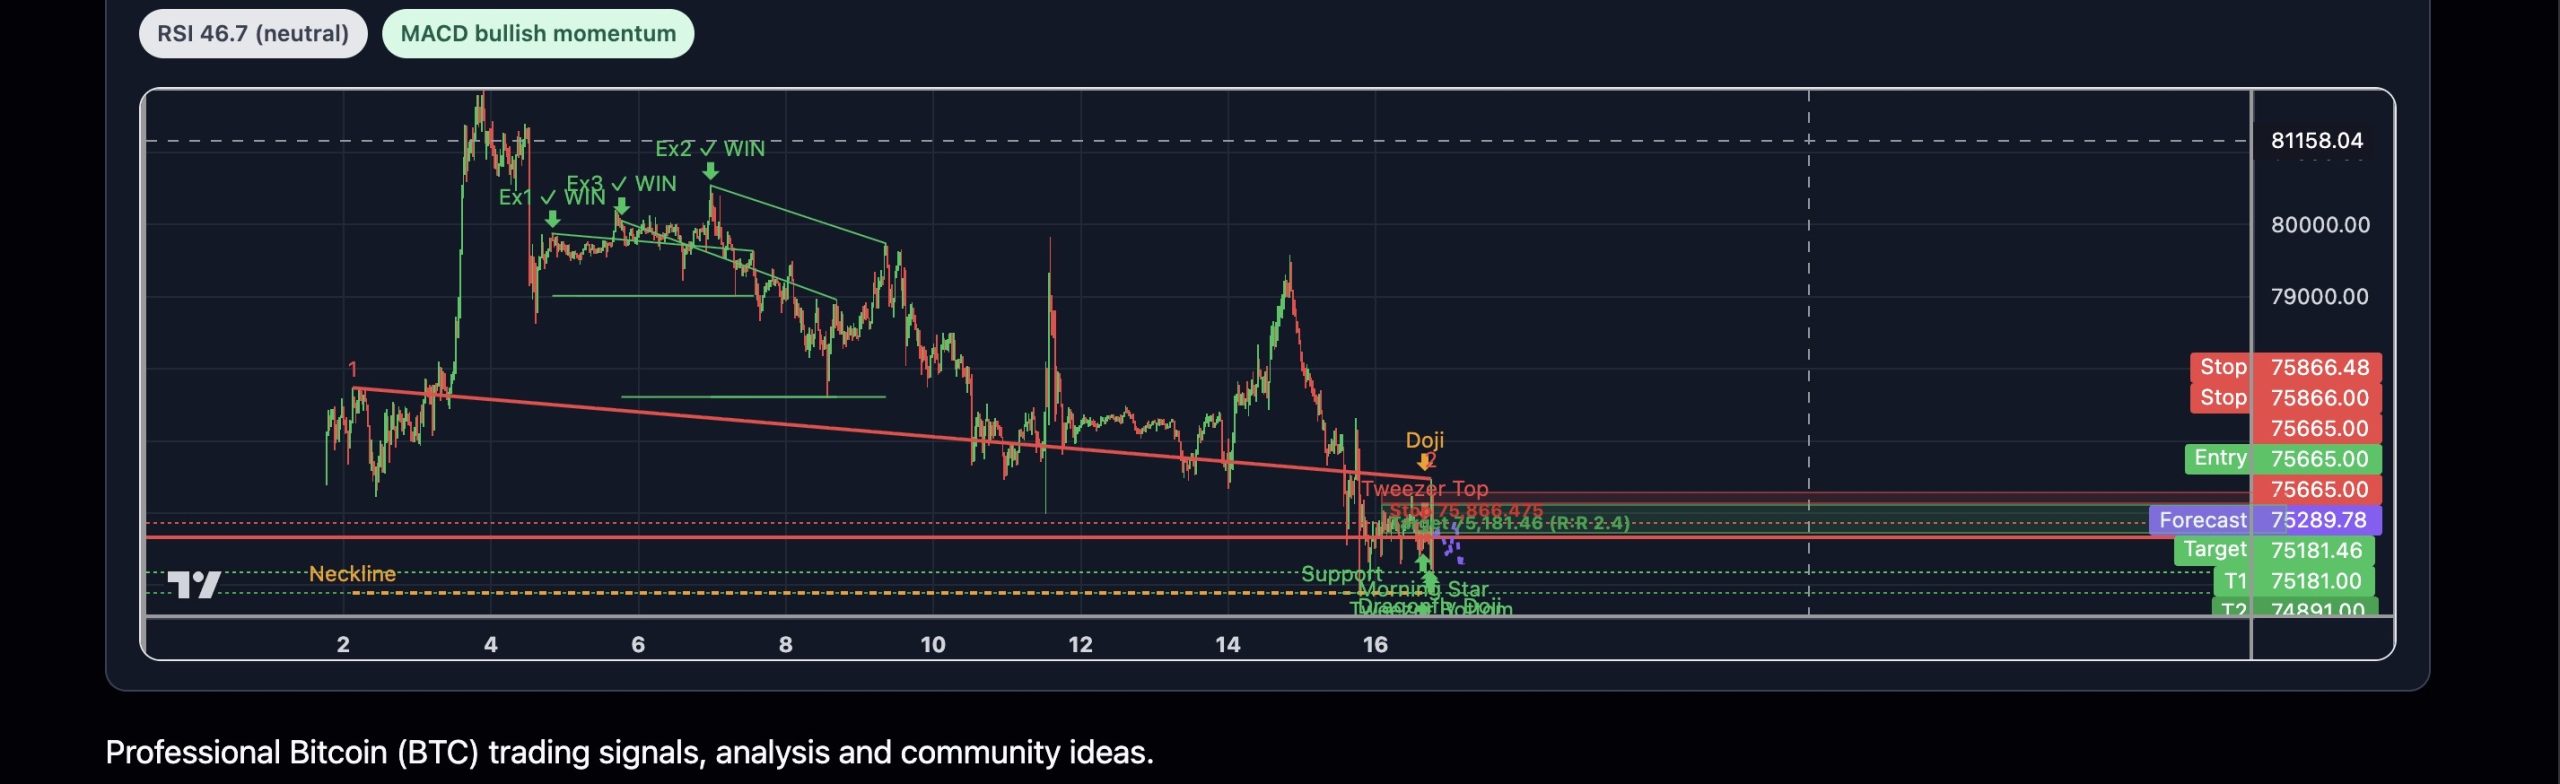
With the inverse H&S failed, the algo has correctly identified a Double Top structure playing out on the 30m chart. Peak 1 printed at ~$77,736 and Peak 2 at ~$76,475 — a lower second peak, which is textbook bearish distribution. The neckline sits at $74,891, which is also the key support level; price at $75,665 is hovering just above it. Candlestick signals are mixed — a Morning Star and Bullish Engulfing cluster formed near $75,732, giving a short-term relief bounce, but RSI at 46.7 (neutral, not oversold) and MACD entering bullish momentum from deeply negative territory suggest the bounce may be a dead-cat before neckline breakdown. The historical replay from the best matched prior Double Top on this chart (confidence 77, outcome: WIN) projects price drifting slightly higher into ~$75,877 before rolling over and pushing toward $75,181–$75,244 as the first measured move leg.