

XRP on the 3D chart is forming a well-defined Rising Wedge —…
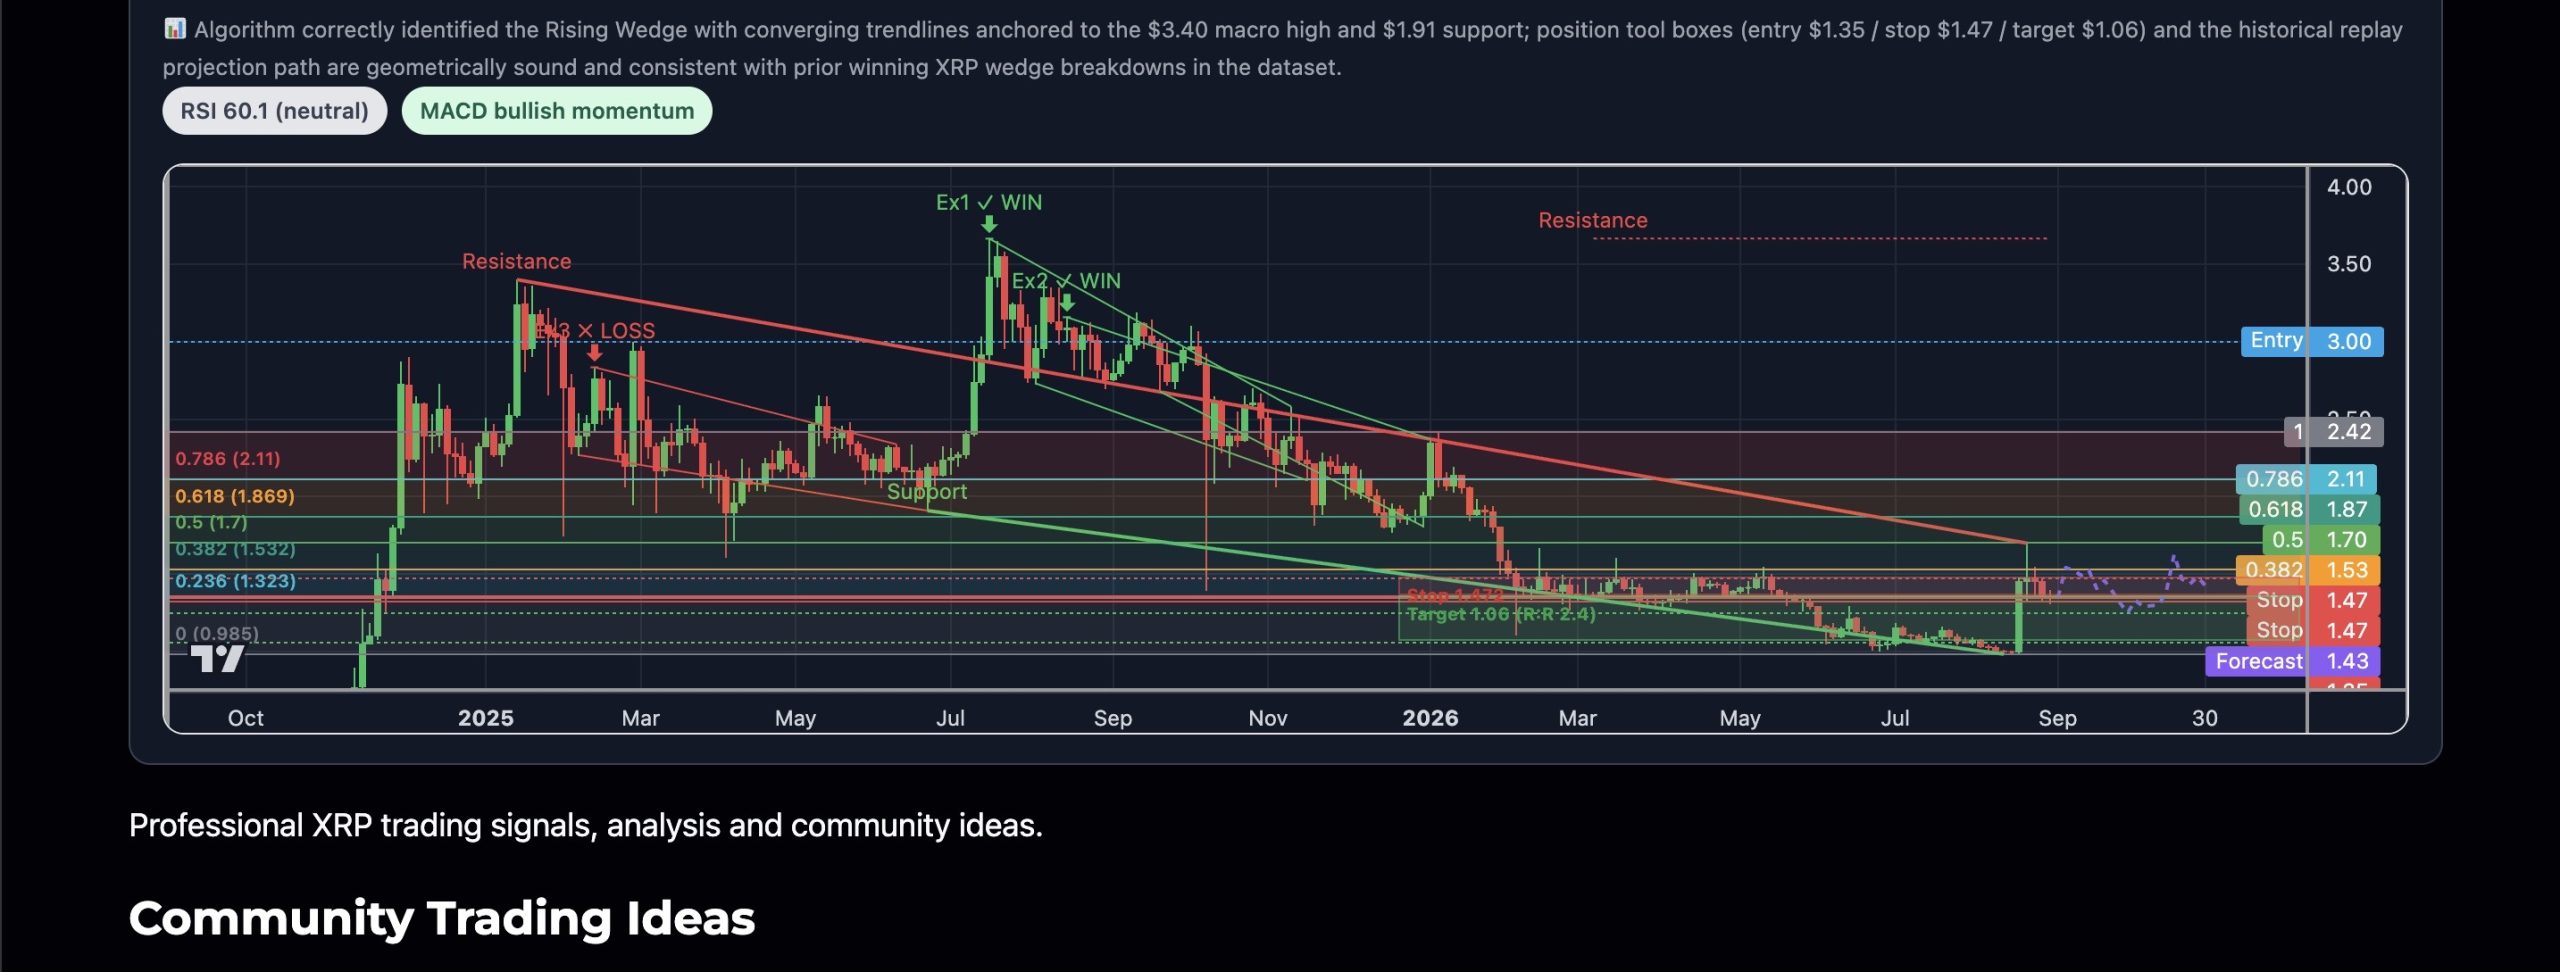
XRP on the 3D chart is forming a well-defined Rising Wedge — a classic bearish continuation/reversal structure with a descending resistance trendline from the ~$3.40 macro high compressing down toward converging support now near $1.91. Price is currently coiling at $1.351, with both trendlines squeezing. Historically, 5 prior wedge instances were found in XRP’s own data; the most analogous winning plays (mid-2025 examples at $3.66→$2.58 and $3.16→$2.37 resistance breaks) resolved to the downside after a brief failed breakout spike. RSI sits at 60.1 (neutral, no overbought divergence yet) and MACD histogram is mildly bullish at +0.049 — suggesting one final push into wedge resistance before the break. The projected path via historical replay shows a near-term bounce toward ~$1.54–1.54, then a sustained rollover targeting the $1.06 measured-move level over the following 3D candles. Fibonacci 0.236 retracement ($1.32) is immediate support; a clean close below opens the full leg to $0.98 swing low territory.