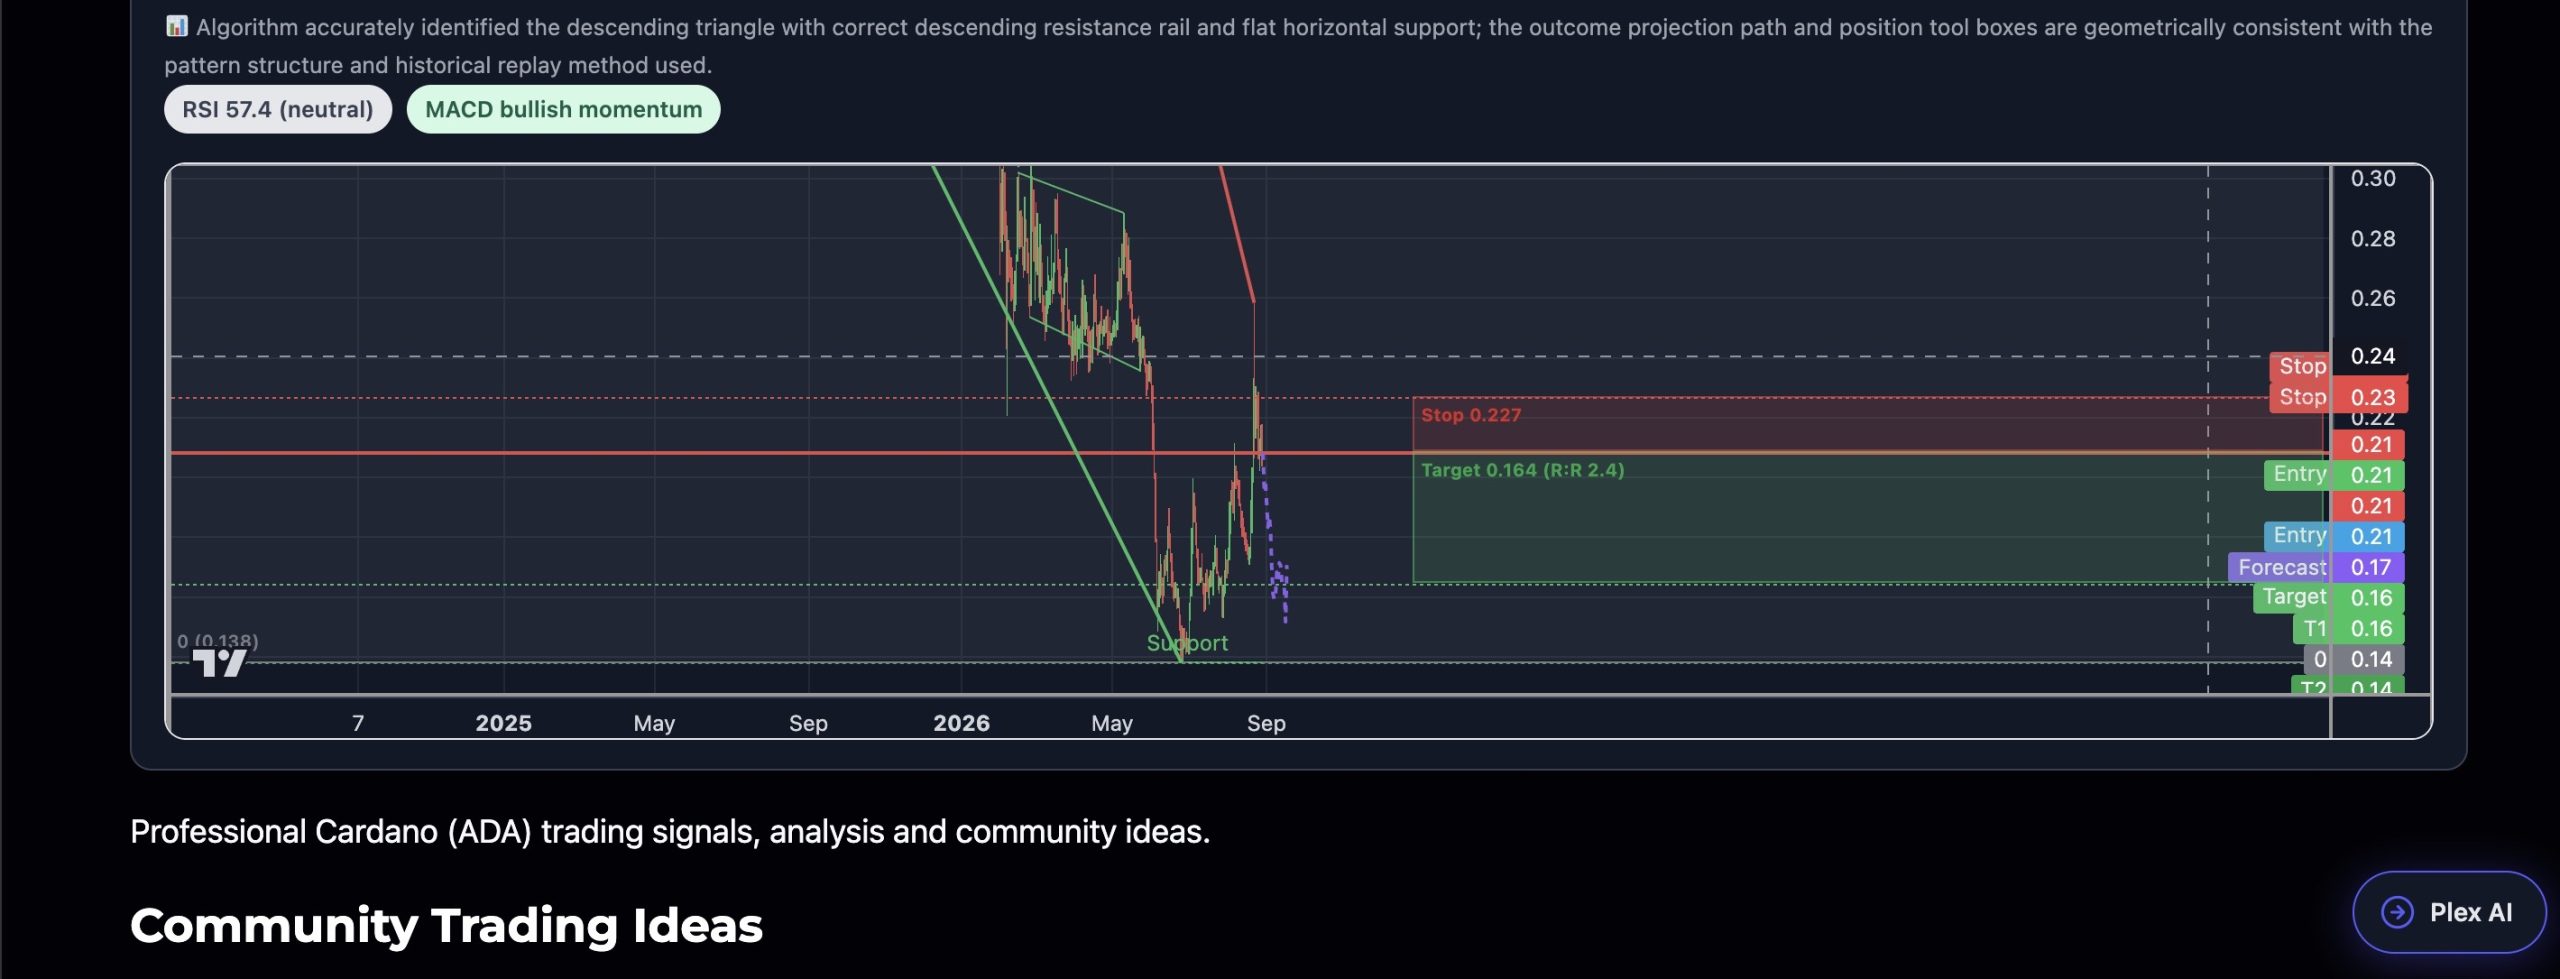


ADA is printing a textbook Descending Triangle on the 1D chart — a series of lower highs compressing into a flat horizontal support shelf near $0.138. Price has already broken below the apex compression zone and is coiling near $0.208, sitting above the flat base support while the descending resistance rail continues to cap recovery attempts. The outcome projection, replayed from the most comparable historical ADA descending triangle (mid-2025 cycle), maps a grind lower over ~20 candles into the $0.151–$0.164 target zone before any meaningful bounce. RSI at 57.4 is neutral — not yet oversold, meaning further downside has room to develop without a forced reversal — while MACD is printing a slight bullish histogram (0.00087) that could represent a final ‘dead-cat’ coil before continuation. The Fibonacci 0.236 retracement from the major swing sits at $0.346, now acting as macro overhead resistance, with the swing low at $0.138 as the critical structural floor — a breach there opens the door to sub-$0.13 territory.