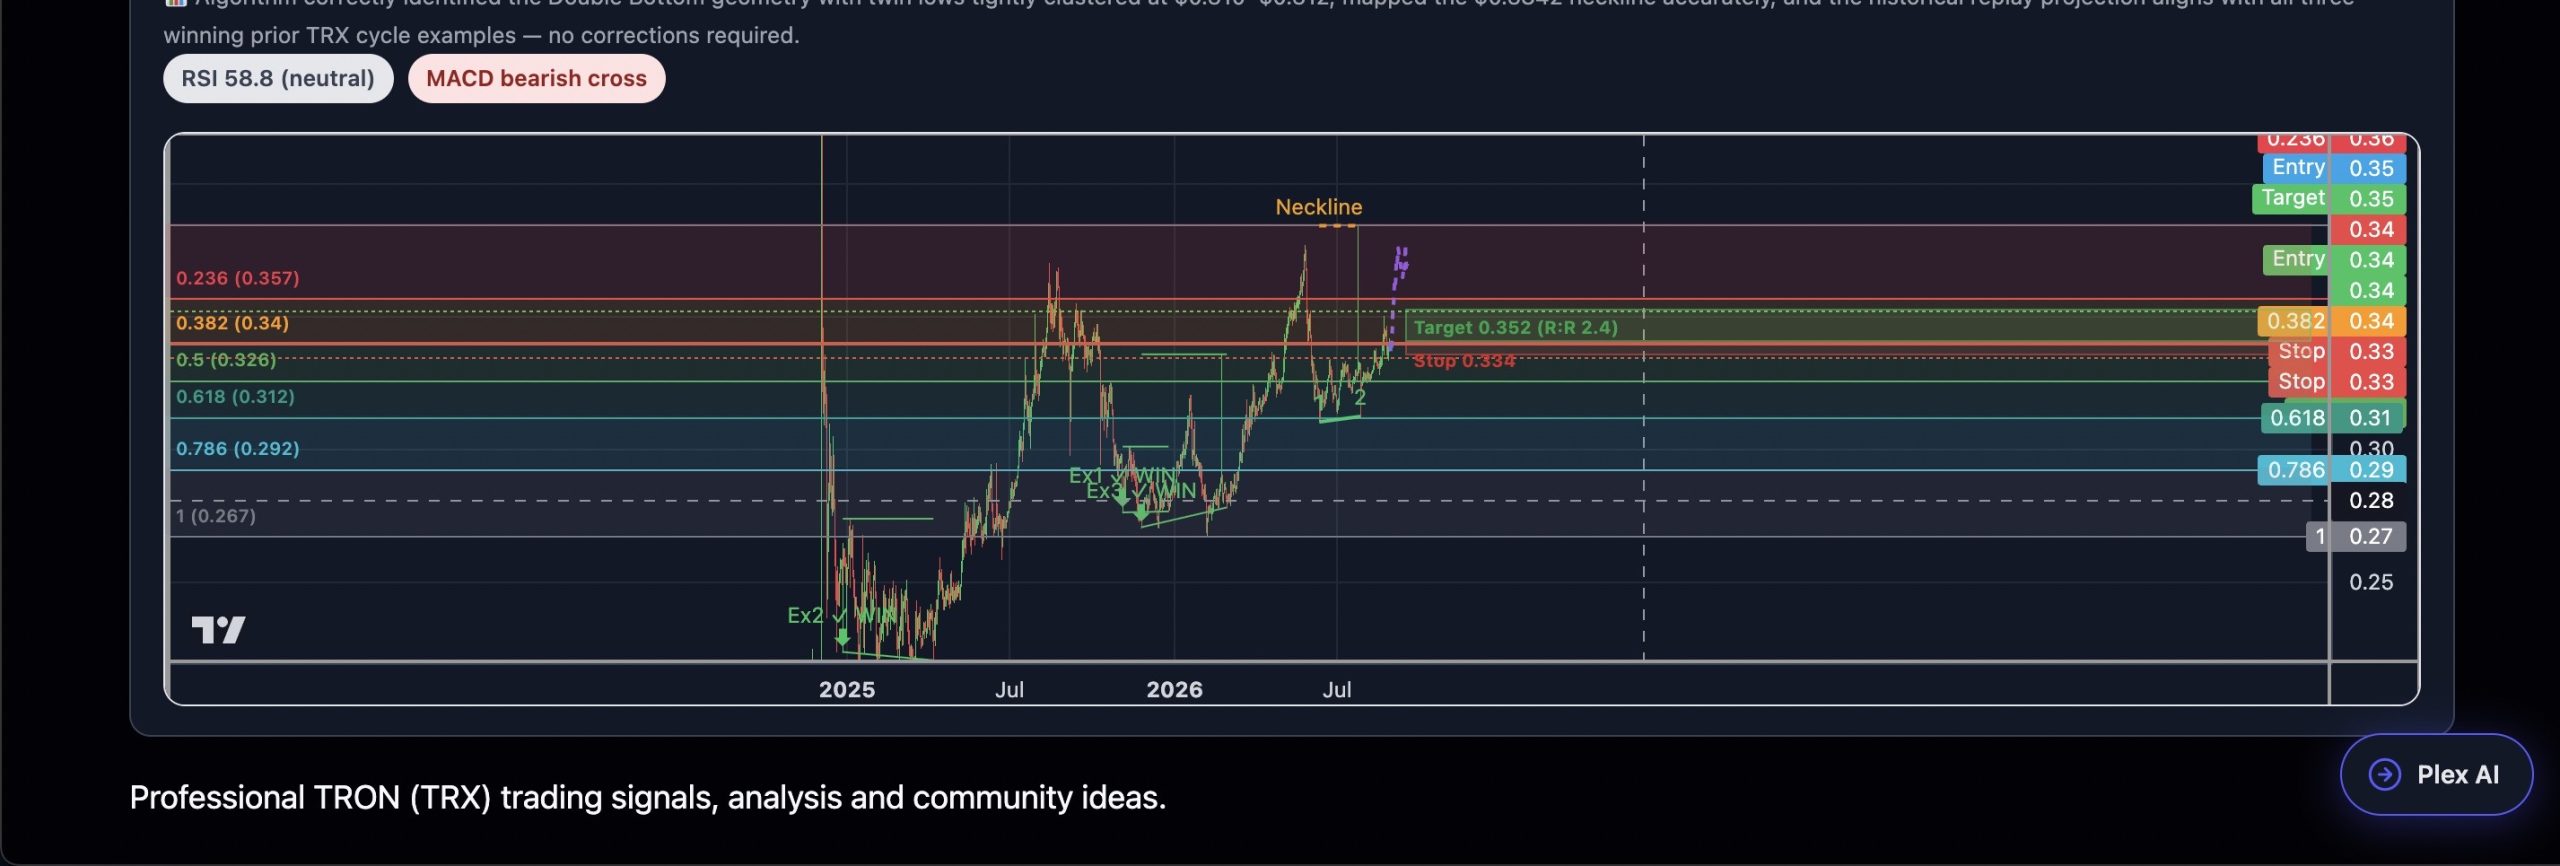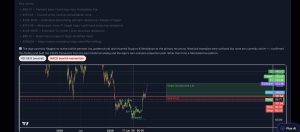


TRX is printing a textbook Double Bottom on the 1D chart, with twin lows at $0.3104 and $0.3124 — a near-perfect mirror base separated by a recovery swing to the $0.3842 neckline. Price is currently sitting at the 38.2% Fibonacci retracement ($0.3395) of the most recent swing, essentially coiling right at the current price ($0.3396) before a decision. RSI at 58.8 is neutral-to-firm (not overbought, leaving room to run), while MACD just posted a mild bearish cross — signalling a brief retracement or consolidation is possible before the neckline break. Three prior Double Bottom setups on TRX resolved bullishly (wins at $0.276, $0.220, $0.270 bases), all following the same retest-then-rip structure. The outcome projection — replayed from the best matching historical cycle — maps a grind higher from current levels toward the $0.352 near-term target, with continued momentum up toward the $0.384 neckline and potential breakout extension to $0.45 resistance.