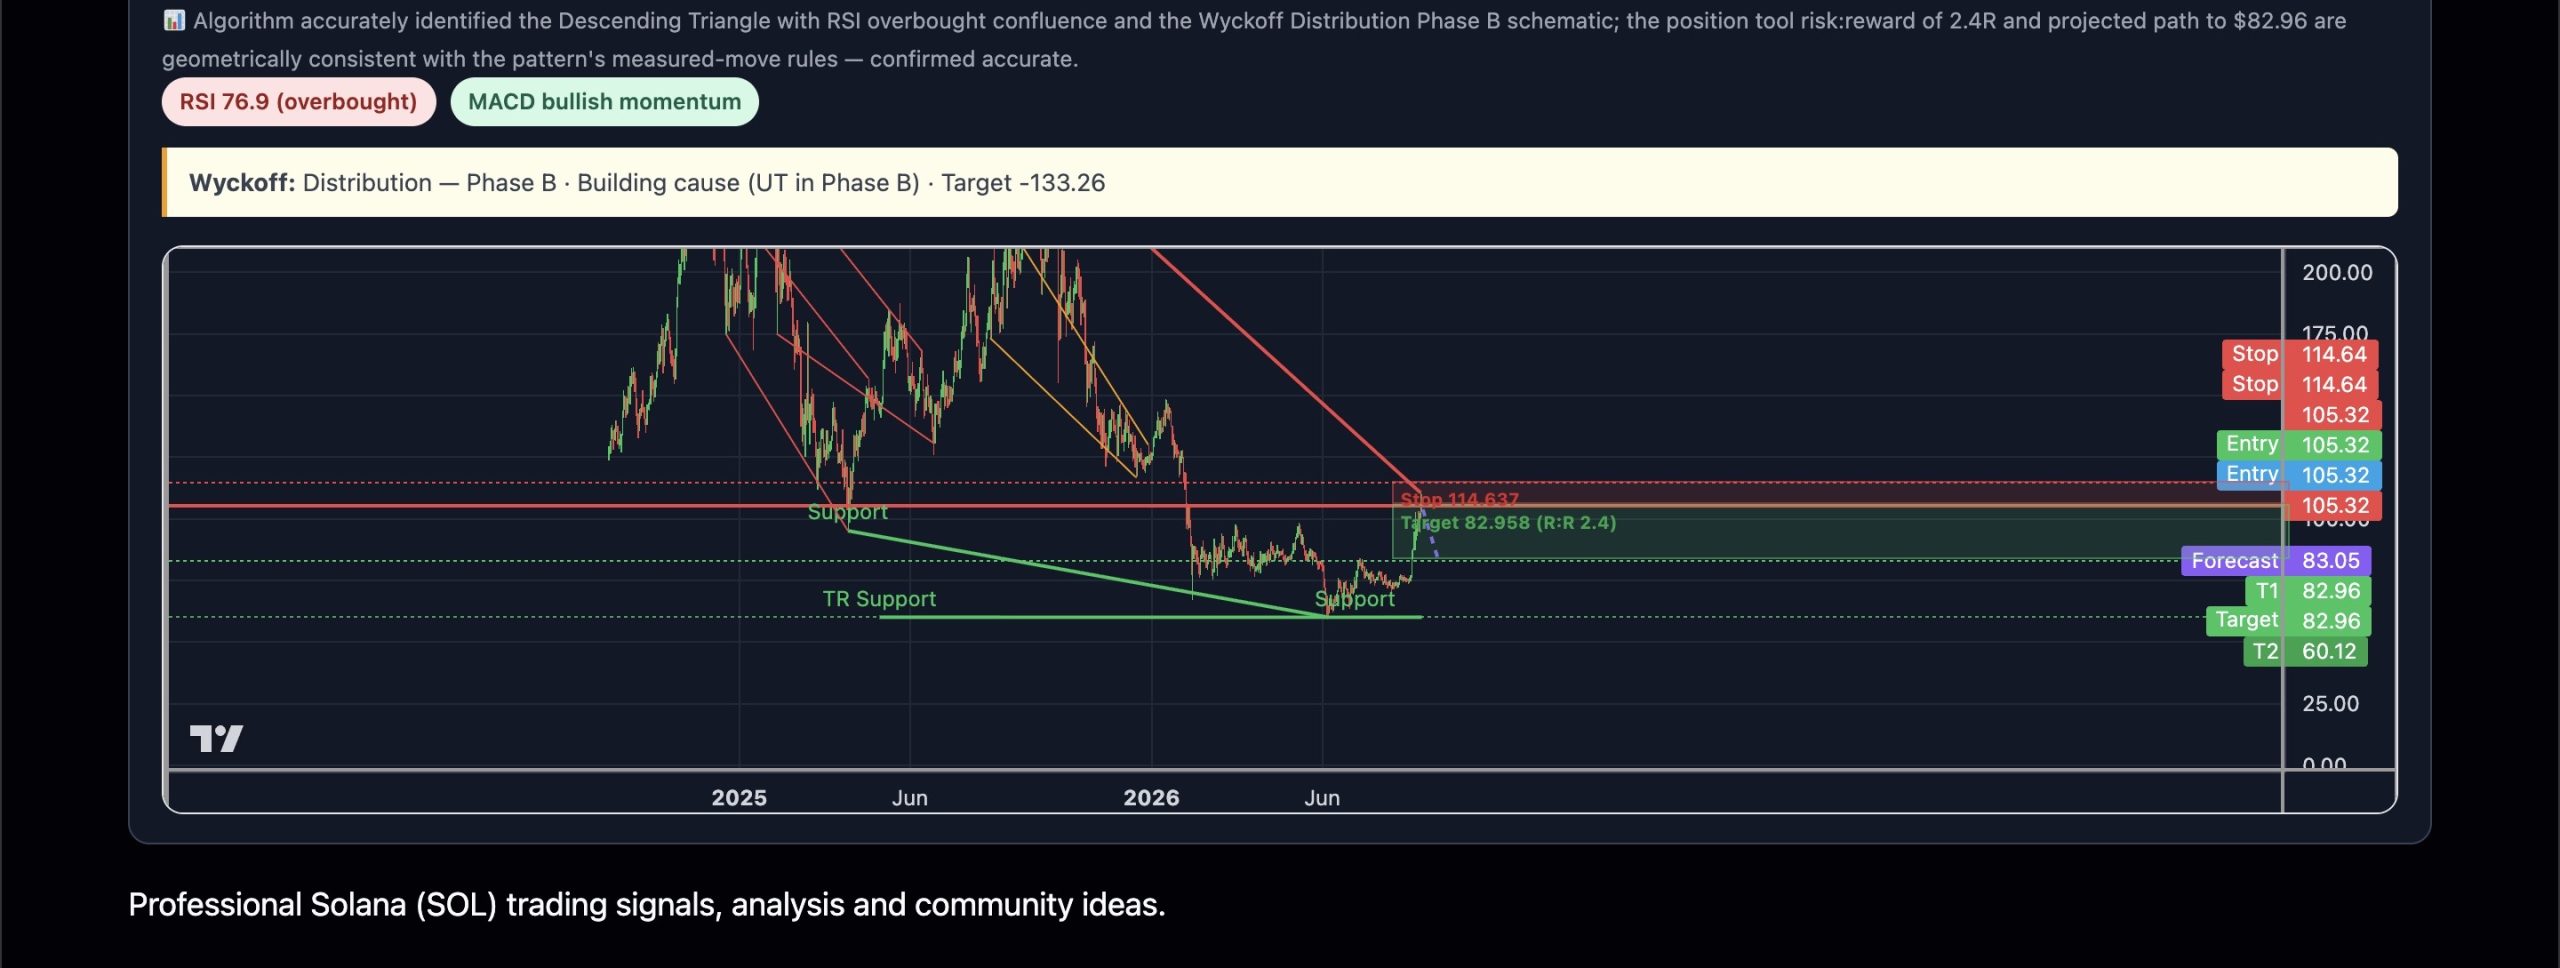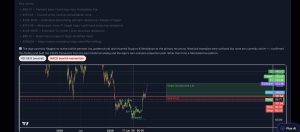


SOL on the 1D chart is forming a textbook Descending Triangle with a declining resistance trendline descending from ~$253.50 and a flat-to-sloping support base near $95–60. The Wyckoff overlay confirms a Distribution schematic in Phase B, with the current price action (~$105.32) representing a potential Upthrust After Distribution (UTAD) — a classic bull trap before markdown begins. Crucially, RSI sits at 76.9 (overbought) while MACD shows bullish momentum — a divergence between price exuberance and pattern structure that historically precedes sharp reversals. The outcome projection, replayed from the best historical analogue, targets a decline to ~$82.96 over the next 15 sessions, with the measured-move downside extending toward the $60 structure support.