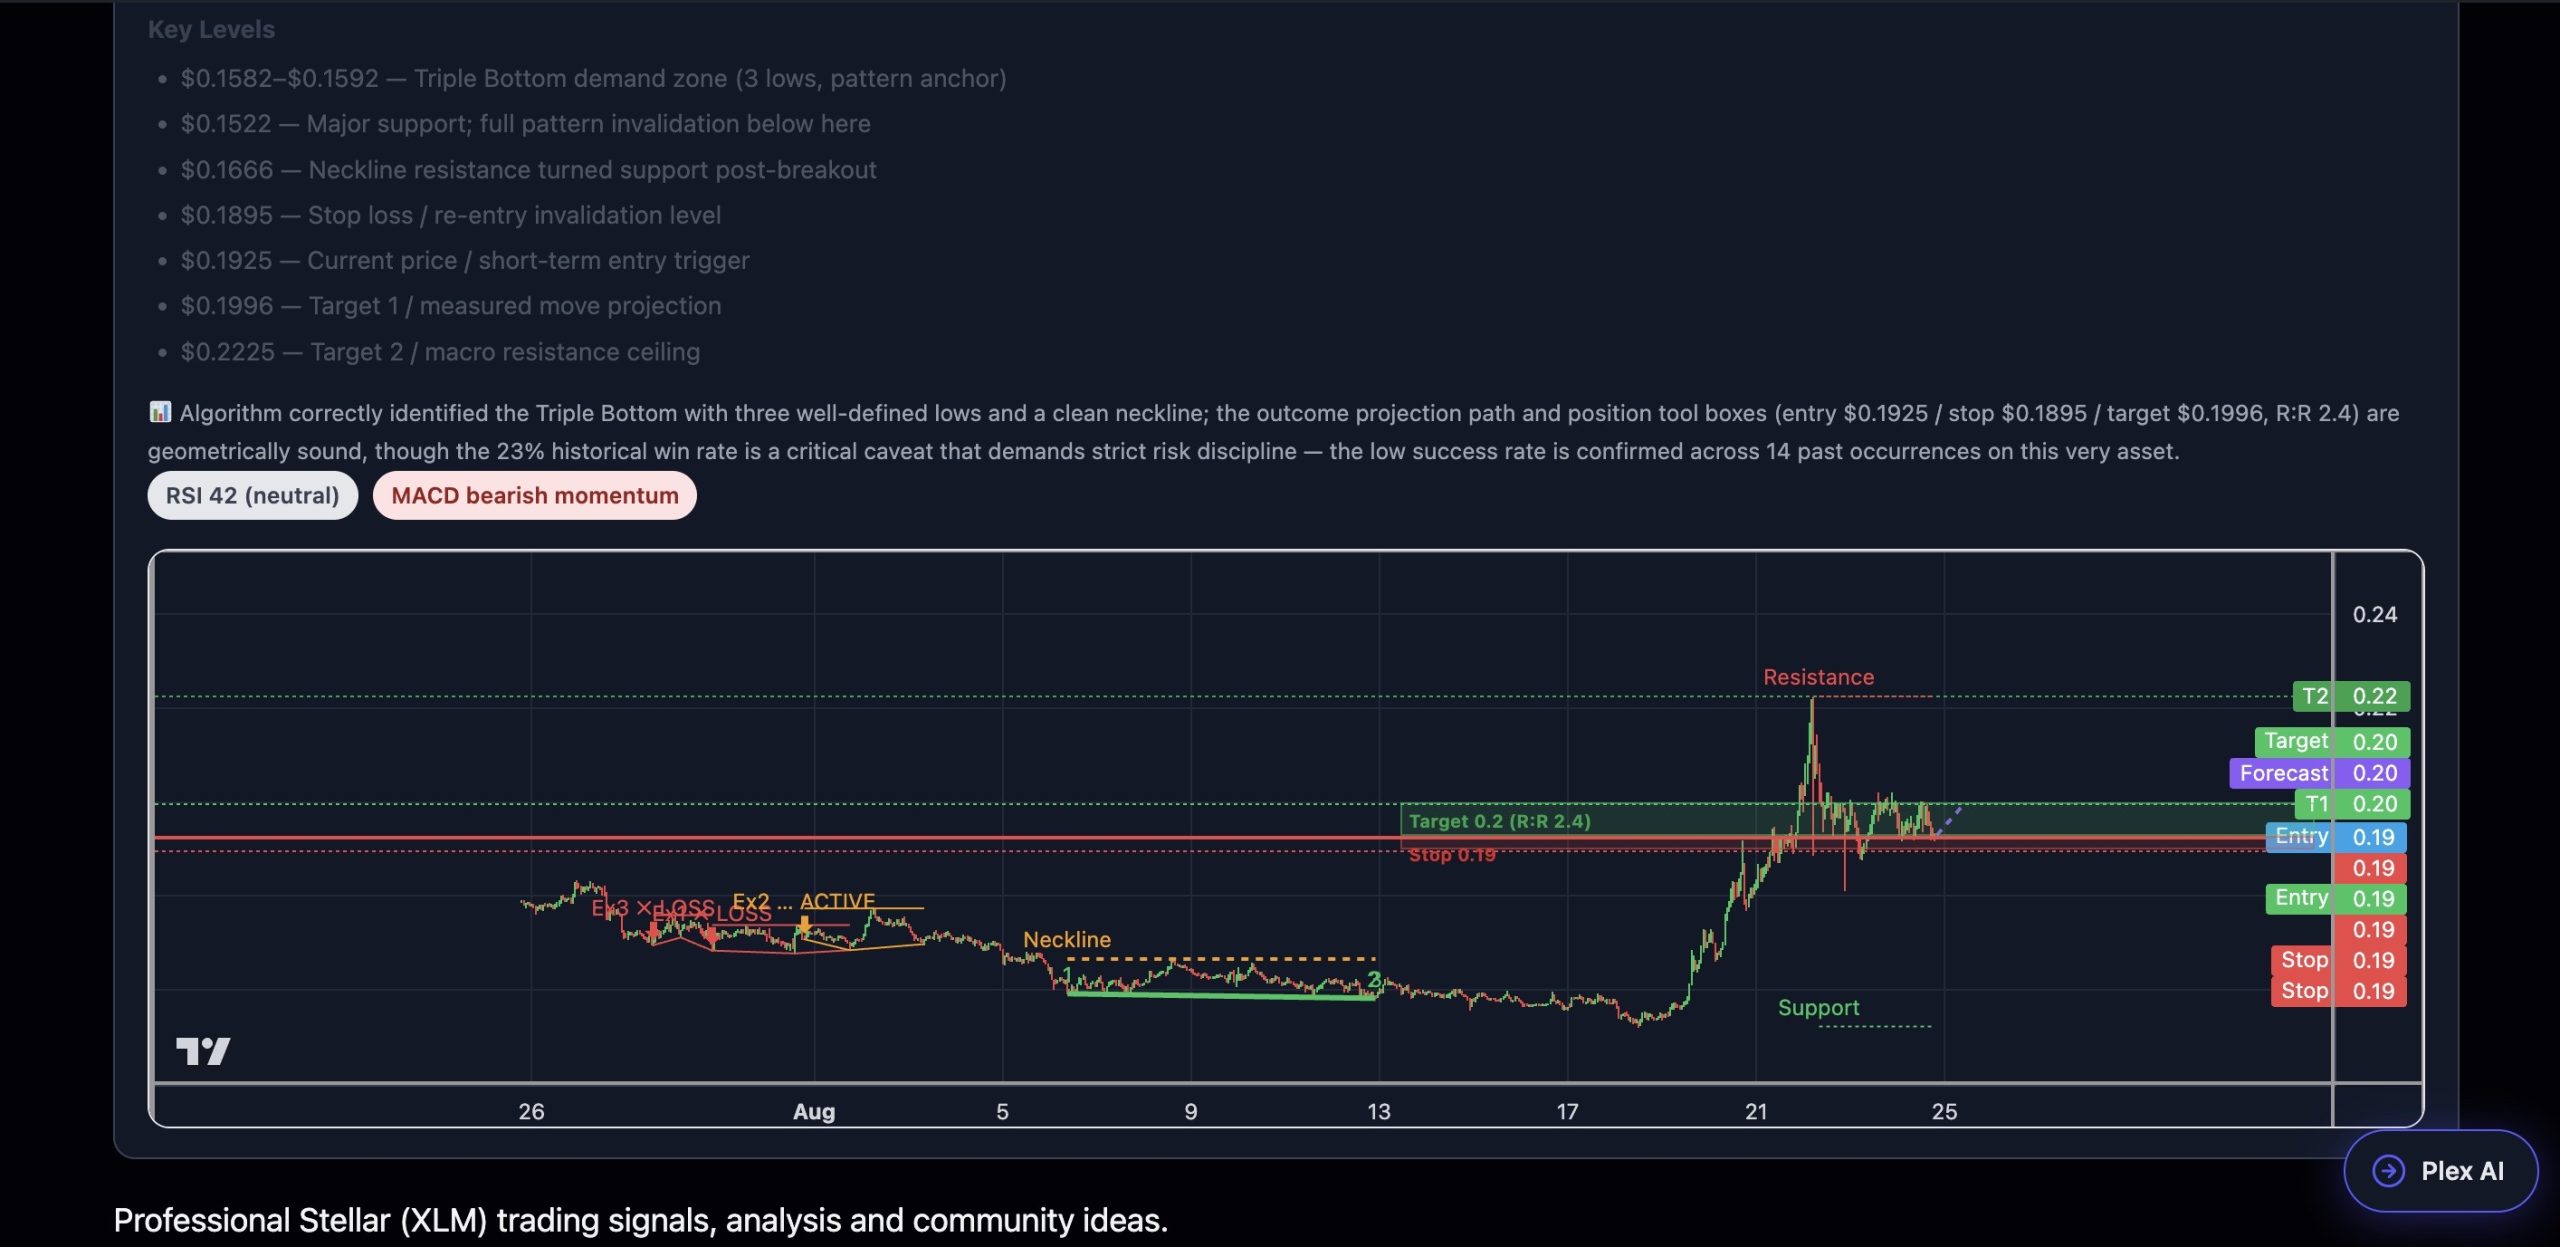


XLM is printing a Triple Bottom structure on the 1H chart with three lows clustering tightly between $0.1582–$0.1592, defining a strong demand zone. The neckline sits at $0.1666, which has not yet been decisively broken to the upside — so the pattern remains unconfirmed. Current price ($0.1925) is trading above the neckline, suggesting the pattern may already be playing out via a prior neckline break; however, the RSI at 42 is neutral-to-weak and the MACD is in active bearish momentum (histogram: –0.0004), flagging that the breakout leg lacks strong conviction and a pullback retest is likely before continuation. Historical backtests across 562 windows reveal a notably low 23% success rate for this pattern on XLM 1H — indicating traders should manage risk carefully, with tight stops and disciplined scale-out at T1.