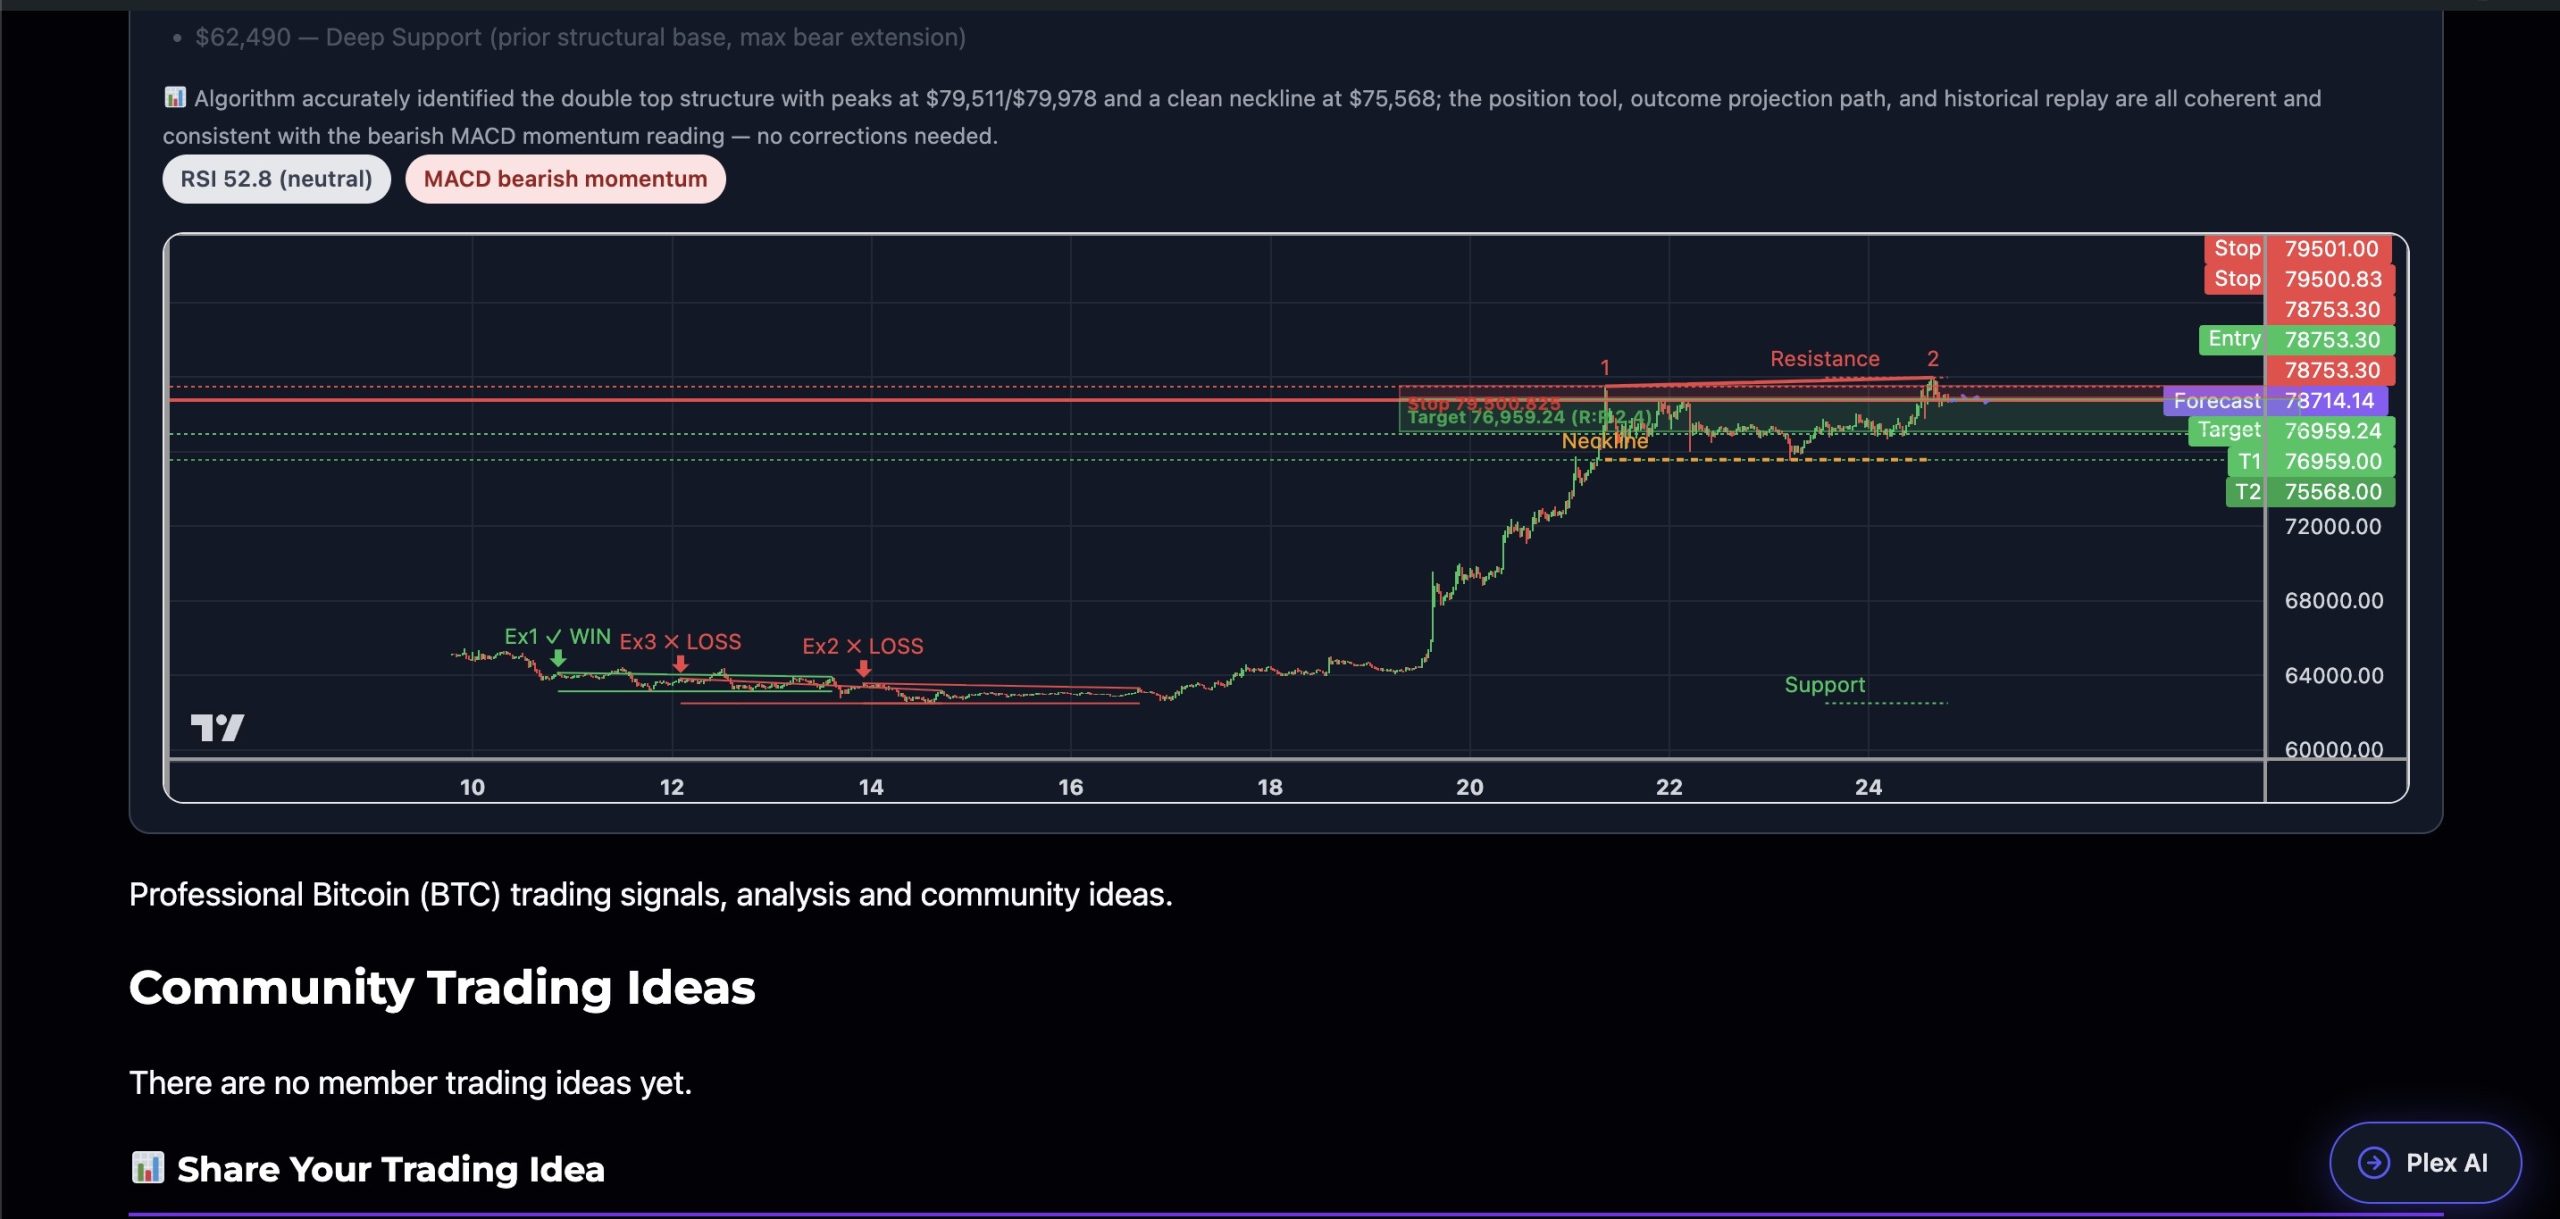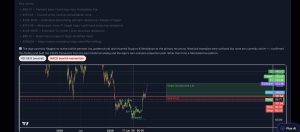


BTC is printing a textbook Double Top on the 30m chart with Twin peaks at ~$79,511 and ~$79,978 separated by a shallow pullback, and a well-defined neckline at $75,568. Price is currently consolidating just below the resistance zone at ~$78,753 — the second top is slightly higher than the first (a ‘false breakout’ variant common at cycle highs), which historically accelerates the breakdown once momentum fades. MACD is in bearish momentum territory (histogram: -73, signal crossing below MACD line at 413 → 340), while RSI at 52.8 is neutral — neither oversold enough to bounce nor overbought enough to warn of a top reversal trap; this neutral RSI with bearish MACD divergence is a classic pre-breakdown confluence. The outcome projection (replayed from the best historical double top match at 77% confidence) maps a distribution phase of sideways chop near current price before a sharp leg lower toward the neckline. The measured-move target from the pattern height (~$4,410 drop from peak) projects to ~$75,568 (T1) and ~$74,140–$73,800 (T2 extended).