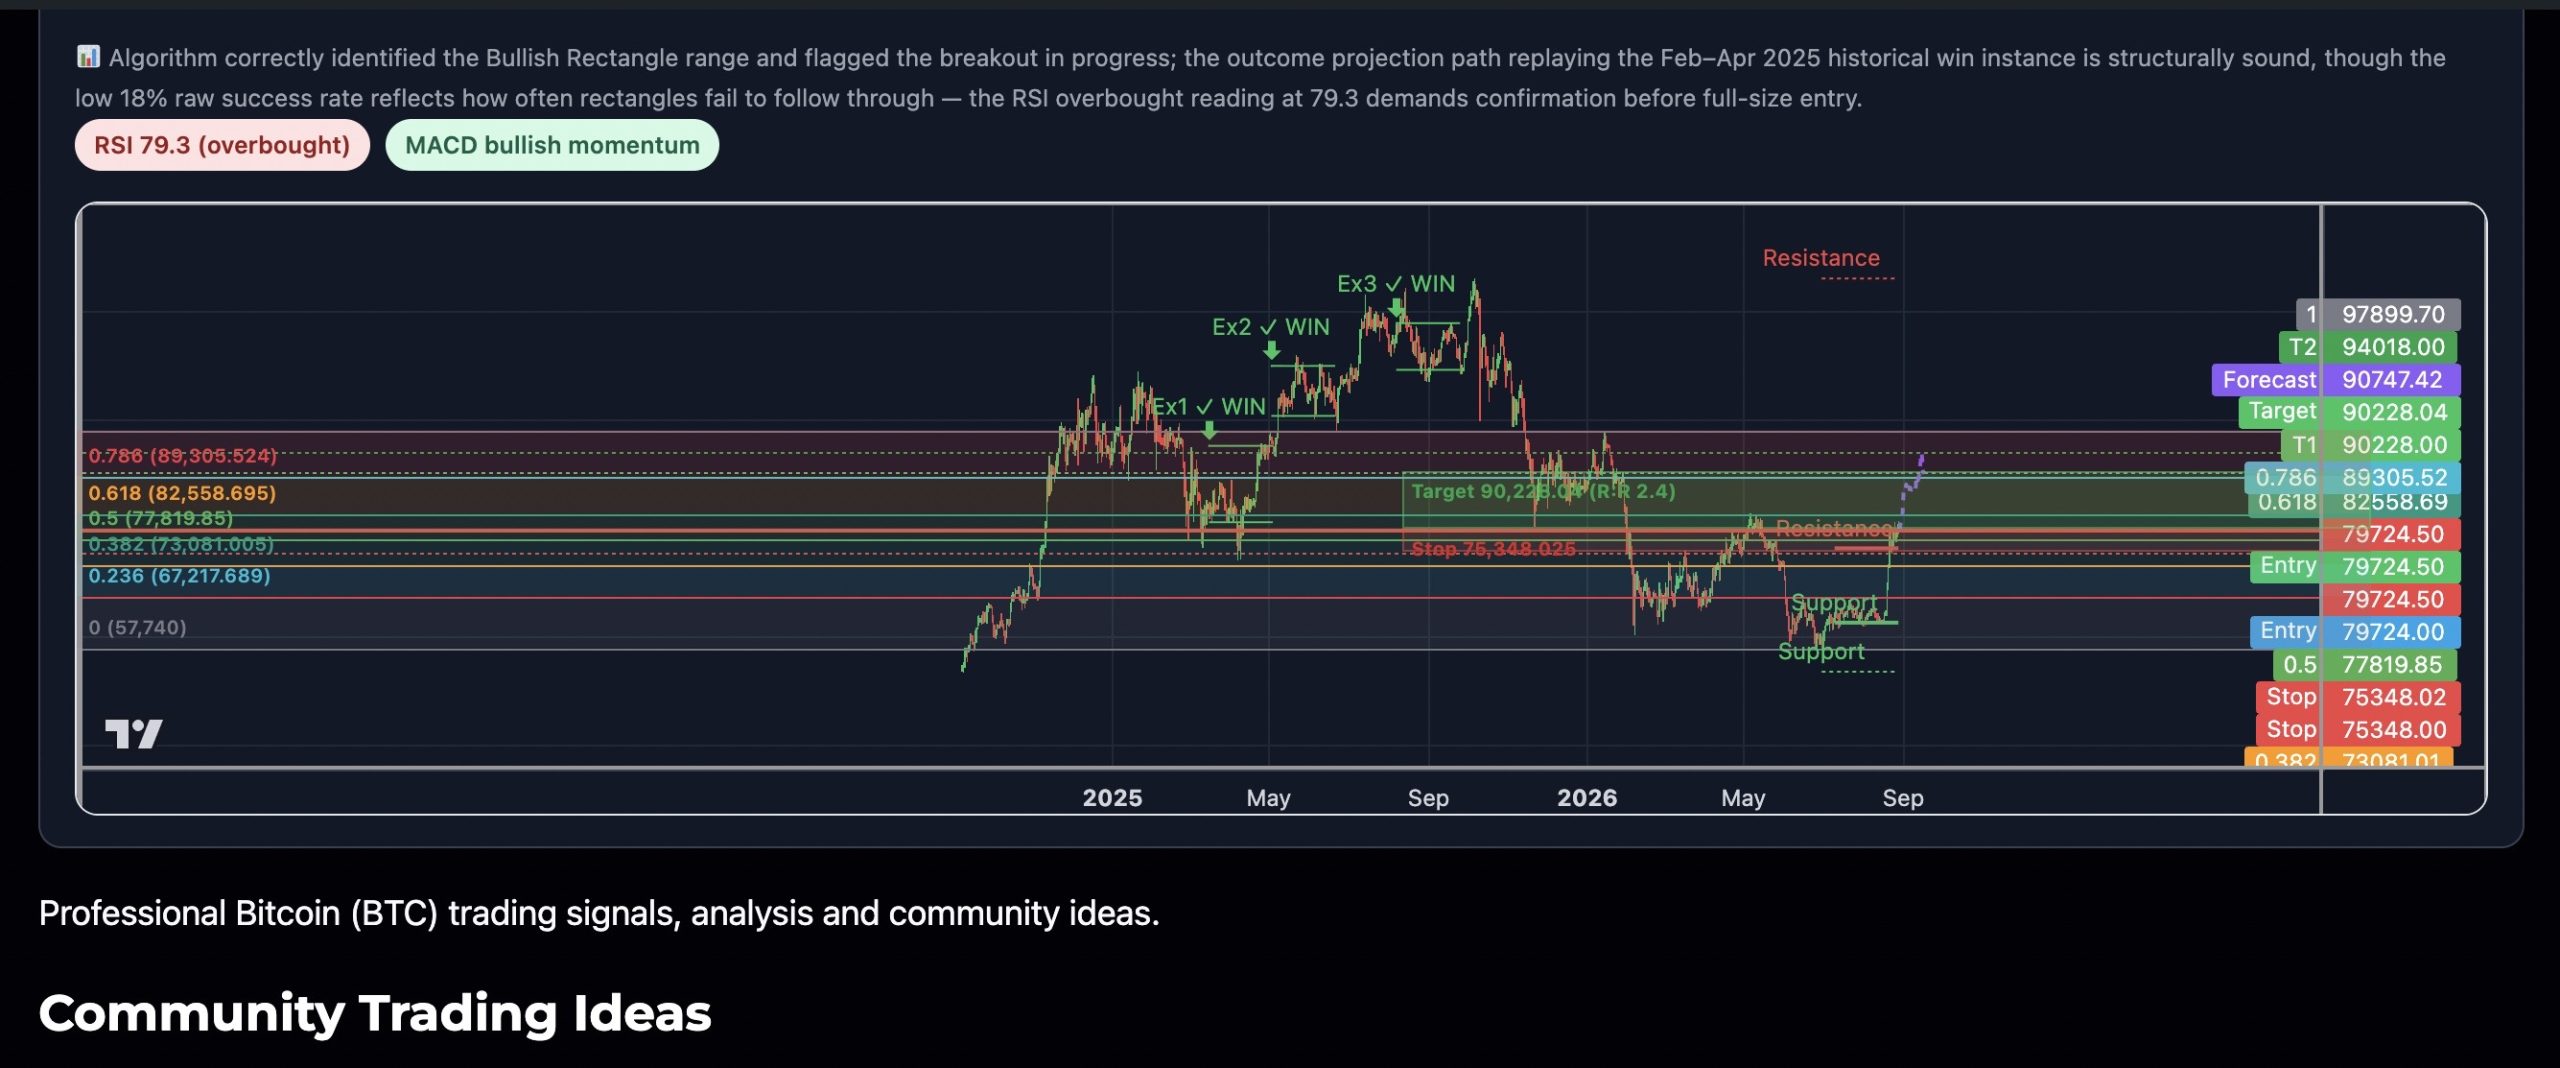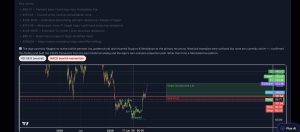


BTC on the 1D chart is carving a well-defined Bullish Rectangle between the $62,668 support shelf and the $76,408 resistance ceiling, a ~13,700-point consolidation band formed after the rejection from the $97,899 cycle peak. Price is currently sitting at $79,724 — notably, it has already punched through the immediate rectangle resistance, which is a constructive sign. The outcome projection, replayed from the most comparable historical cycle instance (the Dec 2024 – Feb 2025 rectangle that broke out and ran to $109K), maps a measured-move path toward the $90,228 T1 zone over the next ~20 candles. Indicators add caution: RSI is at 79.3 (overbought) and MACD is in bullish momentum but with histogram decelerating — suggesting a possible brief pullback before continuation. The 0.618 Fibonacci retracement of the $97,899 → $57,740 downswing sits at $82,558, which is the key resistance gatekeeping the full breakout leg. A daily close above $82,558 with volume confirmation would be the high-conviction green light for the projected path toward $90,228–$94,018.