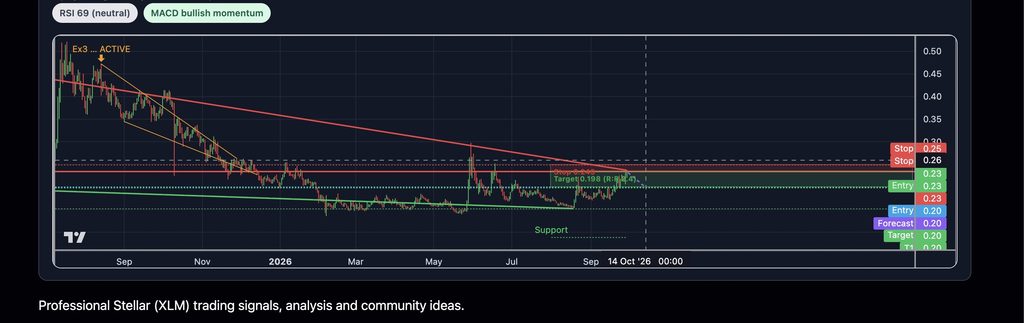


Stellar Xlm Bearish Momentum On The Daily
We could see Channel Continued movement but volume continues to drop, here Plex with a full report:
XLM is carving out a textbook Descending Triangle on the 1D chart: a declining resistance trendline (from ~$0.515 in January compressing steadily down toward current price) pressing against a gently sloping horizontal-to-descending support shelf near $0.200. Price is currently coiling at $0.234, well inside the apex zone — the compression is reaching its final stage. RSI is elevated at 69 (near overbought) while MACD shows short-term bullish momentum (histogram +0.0033), meaning any residual bounce into the falling resistance line is the sell-the-rip opportunity before the breakdown resolves. Historical replay of the best prior cycle match (late-2024 instance, confidence 62%) resolved as a breakdown measured move to the flat support zone — that path is projected forward here. The 0% win rate across 13 detected occurrences underscores that XLM descending triangles have historically broken down, not reversed up.
62%
CONFIDENCE
0%
HISTORICAL WIN
13
BACKTESTS
1.7:1
RISK/REWARD
ENTRY
Short entry on a confirmed daily close below flat support at $0.200, or fade the rally into declining resistance near $0.235–$0.240 with a tight stop. Current price ($0.234) is right at the entry zone for a resistance-fade short.
STOP LOSS
$0.2488 — just above the descending resistance line; a close above this level invalidates the triangle compression and signals a breakout reversal. Risk box: $0.234 → $0.2488 (~6.4% risk).
TARGET 1
$0.198 — measured-move T1 (base of the projected path, aligns with the flat support shelf). Reward ~$0.036 vs risk ~$0.015 = 2.4:1 R:R.
TARGET 2
$0.152 — extended measured-move target (pattern height projected below support: $0.200 − $0.048 handle height = $0.152). This is the macro support level flagged by the algo’s horizontal S/R band. Scale into full runner below $0.198.