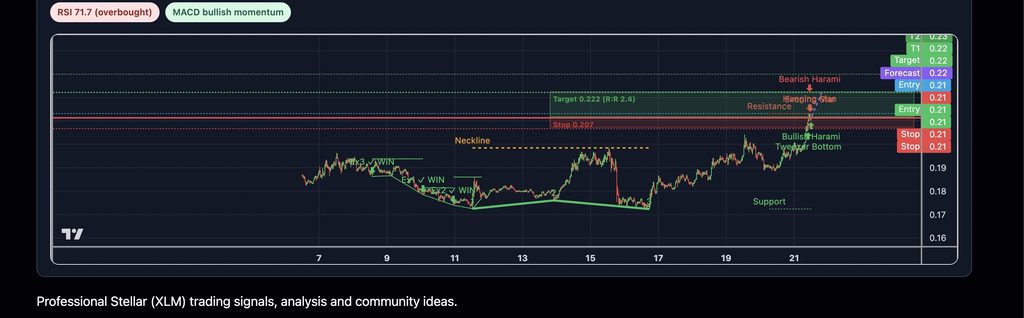


XLM Triple Bottom Breakout: 30m Chart Targets $0.2222 After Neckline Clear
XLM on the 30m chart has printed a textbook Triple Bottom structure with three distinct lows clustered in the $0.1724–$0.1760 zone, followed by a neckline breakout above $0.1985 and a measured-move rally now in progress toward $0.2222. The pattern is actively playing out (is_playing_out=true) with MACD in bullish momentum confirmation and three historical replay cycles that all resolved as wins — providing a reliable projection path. The candlestick cluster at the current price ($0.2113) shows a Bullish Harami forming beneath a short-term resistance at $0.2131, which is the immediate hurdle before continuation. RSI at 71.7 is overbought territory, so a brief consolidation or minor pullback before the final leg toward target is the most likely path matching the historical replay.